There’s no official government definition of a “middle class home.” Which is exactly why the term causes so much confusion online. But underneath the vague label, real numbers do consistently show up affordability ratios lenders actually use. Square footage ranges that repeat across markets, and income thresholds that shift dramatically by region. This piece skips the vibes-based debate and walks through the actual math and physical characteristics that define middle class homes in practice. Plus why identical incomes buy wildly different houses depending on where you live.
The Affordability Math That Actually Defines “Middle Class” Housing
Mortgage lenders use a specific rule of thumb that does more to define middle-class housing affordability than any cultural definition does: the 28/36 rule. Under this guideline, a household’s monthly mortgage payment shouldn’t exceed 28% of gross monthly income. And total debt payments mortgage plus car loans, student loans, credit cards shouldn’t exceed 36%. This isn’t a legal requirement. But it’s the underwriting standard many conventional lenders still reference when evaluating what a buyer can reasonably afford.
How much house can a middle-class income actually afford?
Run the math on a household earning close to the current U.S. median of roughly $83,000 a year. And the 28% rule caps a comfortable monthly mortgage payment around $1,940. At a 6.5% interest rate on a 30-year fixed mortgage, that payment supports a loan amount in the rough neighborhood of $300,000 to $310,000. Before accounting for property tax, insurance, and any HOA fees that would eat into that same monthly budget. That’s a meaningfully smaller number than what median home prices actually run in many metro areas today. Which is exactly why affordability has become such a persistent point of tension for households earning what would technically qualify as middle income.

The Physical Characteristics That Show Up Most Often
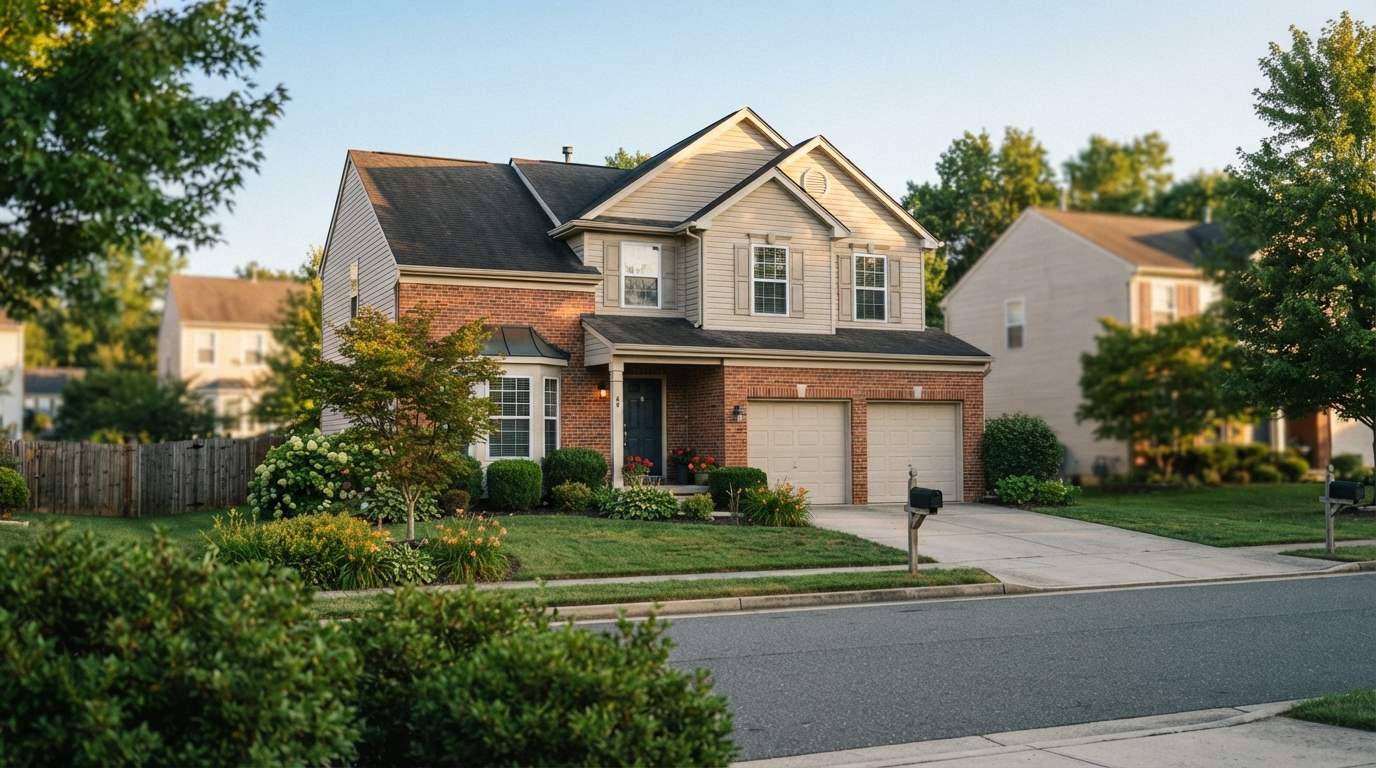
Beyond the financial math, middle class homes tend to cluster around a fairly consistent physical profile across different markets. Even as exact square footage and price vary by region. Three bedrooms and two bathrooms is the most common configuration by a wide margin. Since it accommodates a typical family size without the added cost of a fourth bedroom or additional full bath that pushes a home into a higher price tier.
What’s the average square footage of a middle-class home?
Most homes in this bracket fall somewhere between 1,800 and 2,500 square feet. A range that’s shrunk somewhat in newer construction as builders respond to affordability pressure by trimming square footage. Rather than cutting the price per square foot. Older housing stock built in the 1970s through 1990s often runs smaller still. Frequently in the 1,200 to 1,800 square foot range. Which is part of why older middle-class neighborhoods can offer more affordable entry points than comparably located new construction.
Why the Same Income Buys Wildly Different Homes by Location
This is the piece that trips up national conversations about middle class homes the most. A household earning $83,000 a year is working with a completely different housing reality in different parts of the country. Even before accounting for any difference in home size or condition. In a lower cost-of-living metro, that income might comfortably support a 2,200-square-foot single-family home with a yard. In a high cost-of-living coastal market. The same income and the same 28% affordability ceiling might only support a condo or townhome at a fraction of that size, if it supports home ownership at all rather than continued renting.
This regional gap is exactly why national median statistics about home prices and middle-class affordability can be misleading without local context. A national median home price tells you almost nothing useful about whether a specific middle-income household in a specific city can actually buy a home there, since local price-to-income ratios vary so dramatically.
Why “Middle Class” Itself Has Become Genuinely Contested
Part of the ongoing confusion traces back to how income thresholds for middle class status are defined. The Pew Research Center sets middle-income households at between two-thirds and double the median household income for a given area a range that swings from roughly $53,000 to $161,000 depending on regional cost of living. That’s an enormous spread, wide enough that households at the top and bottom of it experience genuinely different housing markets, even though both technically qualify under the same label.
This gap has become a visible cultural flashpoint recently, with viral social media content showing “average” or “normal” home tours sparking extensive debate over whether a given household’s home actually reflects middle-class reality or looks more affluent than the label suggests. That online disagreement isn’t really about decor or taste it’s a symptom of how unevenly a technically middle-class income actually stretches depending on where someone lives.
Practical Signs You’re House-Hunting in the Right Range
Rather than relying on a national median price figure, calculate your own local price-to-income ratio before assuming a listing fits a middle-class budget. Divide a home’s asking price by your household’s gross annual income; a ratio under roughly 3.5 to 4 generally aligns with sustainable affordability under standard lending guidelines, while anything meaningfully higher signals you’d be stretching well beyond what the 28/36 rule considers comfortable, even if a lender is willing to approve the loan.
Comparing a specific listing against your area’s actual median home price, rather than a national figure, gives a far more accurate read on whether you’re shopping in a realistic middle-class range for where you actually live, since local markets can diverge from national medians by well over 50% in either direction.
Conclusion
Middle class homes aren’t defined by a single price point or an official government threshold they’re defined by a combination of affordability math, typical size and configuration, and a local cost-of-living context that varies enormously by region. Run your own numbers against the 28/36 affordability rule, compare listings to your specific local market rather than a national median, and treat the broader cultural debate over the label itself as far less useful than the concrete math behind what you can actually afford.
FAQs
What income is considered middle class for buying a home?
Using Pew Research’s definition, middle income falls between two-thirds and double the local median household income, which nationally works out to roughly $53,000 to $161,000, though the exact range shifts significantly by metro area cost of living.
How much of my income should go toward a mortgage payment?
Most lenders reference the 28/36 rule, capping a comfortable mortgage payment at 28% of gross monthly income and total debt obligations at 36%, though your specific comfortable number may be lower depending on other financial priorities.
Why do middle class homes look so different in different cities?
Local cost of living and home price-to-income ratios vary dramatically by region, so the same income supports a much larger home in a lower-cost market than in a high-cost coastal metro, even before accounting for differences in home age or condition.
Is 2,000 square feet considered a middle-class home size?
Yes, generally most middle-class homes fall between 1,800 and 2,500 square feet, making 2,000 square feet a fairly typical size, though older housing stock in this income bracket often runs smaller.